Glass Bottles Help with Hydration but Fruit is also Critical
There is a common misconception that we need to get all of our water from drinking but that is simply not true. We at Glasstic Bottle encourage people to rely on thirst as the primary indicator for when to grab their shatterproof glass water bottle and take a drink of cold refreshing water. You say how can this be? I thought that people required 64oz or even more of water per day?? Why would a glass water bottle company be talking about not having to drink tons of water per day?? The answer is simple; most foods, especially fruits and vegetables contain relatively large amounts of water that when eaten add to your body’s hydration level sort of as if you had taken a large drink of water.3
The following data is derived from a terrific resource, Bowes and Church’s Foods Values of Portions Commonly Used. While we feel this is very useful information and have included it below we also want to share with you another way of looking at your fruits and vegetables the next time you sit down to snack.
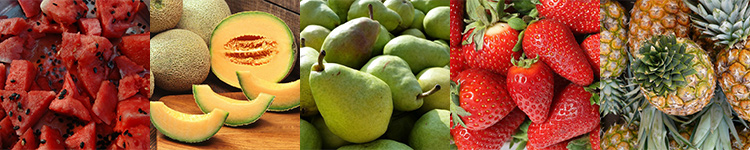
Notice that in the following table, when ranked traditionally, % of water in fruit, the top two fruits are watermelon and strawberry. Each have 92% water as a percentage of total weight of the fruit. This is a large percentage but when considering total hydration from a common portion (CP)1 you can see that the watermelon is truly #1 with strawberries now coming in at #4. You can use this table as a rough guide of how many ounces of water are in a common portion of your favorite fruit or to determine the percentage of water in fruit.
|
Fruit Type |
% Water1 | Rank by % Water | Rank by Amount of Water per CP2 |
Approx. OZ of Water per CP1 |
|
|
Watermelon |
92% | 1 | 1 | 4.9 | |
|
Strawberries |
92% | 1 | 4 |
4.6 |
|
|
Grapefruit |
91% | 2 | 9 |
3.7 |
|
|
Cantaloupe |
90% | 3 | 2 |
4.8 |
|
|
Peach |
88% | 4 | 14 |
2.5 |
|
|
Pineapple |
87% | 5 | 5 |
4.5 |
|
|
Orange |
87% | 5 | 7 |
4.1 |
|
|
Raspberries |
87% | 5 | 10 |
3.5 |
|
|
Cranberries |
87% | 5 | 13 |
2.7 |
|
|
Apricot |
86% | 6 | 11 |
3.1 |
|
|
Blueberries |
85% | 7 | 6 |
4.1 |
|
|
Plum |
85% | 7 | 16 |
1.8 |
|
|
Pear |
84% | 8 | 3 |
4.7 |
|
|
Apple |
84% | 8 | 8 |
3.9 |
|
|
Grapes |
81% | 9 | 15 |
2.5 |
|
|
Cherries |
81% | 9 | 18 |
1.8 |
|
|
Banana |
74% | 10 | 12 |
2.8 |
Top 5 Fruit in Order of Amount of Water per Common Portion
If you care to let us know what you think about this way to look at fruit and hydration please write us a comment below. We would love to hear from you.
- Pennington JAT. Bowes and Church s Foods Values of Portions Commonly Used.16th ed. Philadelphia, Pa: Lippincott Publishers; 1994
- Ranking based on water weighing 8.34lbs per gallon and 128floz per gallon using water weight data from Bowes and Church’s Food Values of Portions Commonly Used any errors in calculations are Glasstic Bottle Co.
- Institute of Medicine of the Nation Academies, Dietary Reference Intakes: Water, Potassium, Sodium, Chloride, and Sulfate; 2004
